In this blog series, we will explore the mathematics of virology, sharing insights that reveal new dimensions in our results and guide us from awareness to creativity.
In the first of the series, we looked at the plaque assay and the TCID50 assay – the two main techniques to quantify infectious virus in a stock or experimental sample.
From TCID50 to IU
So, we have two commonly used methods for virus quantification: the plaque and TCID50 assays.
The plaque assay directly counts virus particles by the plaques they form, and the TCID50 assay estimates virus concentration based on the dilution at which 50% of wells show infection.
But does the TCID50 assay return the same results as the plaque assay? Not exactly. They use different units. The plaque assay uses infectious units per milliliter (IU/ml) and the TCID50 assay uses Tissue Culture Infectious Dose 50 per milliliter (TCID50/ml).
But what if we need to translate a TCID50/ml titre into an IU/ml titre? No need to panic, it’s easily done. We simply need to multiply the TCID50/ml value by 0.7.
But where does this 0.7 come from? Remember that element of probability behind the TCID50 method discussed in our previous blog article? That is why. Let’s look in more detail into this.
MOI and probability of infection
By Multiplicity of Infection (MOI) we mean the number of infectious viruses added per cell. So, an MOI of 1 means that we add one virus for every cell; an MOI of 10 means that we add 10 viruses per cell; an MOI of 0.1 means 1 virus for every 10 cells.
We will be now looking at the probability of cells in a monolayer being infected at different MOIs. For this purpose, we need to assume that the cells in question are completely permissive to virus infection and that infection of one cell does not interfere with infection of other cells, or with infection of the same cell by multiple viruses. The biology of virus infection is not really important here, and in fact, while it makes sense for us to keep referring to viruses and cells, from a mathematical perspective, it doesn’t really matter what objects we are talking about.
Due purely to probability, at an MOI of 1, some cells of the monolayer will receive one virus, but some cells will receive two viruses, some three viruses, and some possibly more. Statistically, the probabilities of these events are 36.79% (one virus), 18.39% (two viruses), and 6.13% (three viruses), respectively.
The Poisson distribution
How do we know, at different MOIs, the probability of multiple viruses infecting the same cell? The rule describing this phenomenon is the Poisson distribution, which is used to model the probability of a certain number of events occurring within a fixed interval of time or space:
P(n) = (MOIn × e-MOI )/ n!
This is saying that the probability (P) of observing n events (where the event here is an infection per cell) is a function of the MOI, with a correction downwards (the multiplication by e-MOI).
EXPLAINER BOX: Why this correction downwards by e-MOI
This is because we often observe fewer events (in our case, infected cells) than we might expect. This happens because any cell might be infected by more than one virus. But a cell infected by two or three viruses still only counts as one infected cell.
e (Euler’s number) is a mathematical constant approximately equal to 2.71828. It’s the base of the natural logarithm.
EXPLAINER BOX: Why do we divide by n!?
The division by 𝑛! (factorial of n) accounts for the different possible sequences in which the infections could occur. In simpler terms, it adjusts for the fact that the order in which the infections happen doesn’t matter.
Example with two infections (n = 2)
If we have two infections (n = 2), there are two different ways these infections could occur:
Virus A infects first, then Virus B.
Virus B infects first, then Virus A.
Both scenarios lead to the same final state: the cell being infected by two viruses. The factorial (2!) counts these different sequences (2 in this case) and normalizes the probability by dividing by this number.
This normalization ensures that the probability calculation reflects the correct likelihood of observing exactly two infections in any order, rather than overcounting the different sequences as separate events.
Let’s feed some numbers into the equation to make it clearer. The probability of observing two infections per cell when we use an MOI of 1 is:
P(2) = (12 × e-1)/2! = 1 × 2.718-1 / 2 = 0.1839.
(note: 2! is calculated as the products of all positive integers up to 2, so 1 × 2 = 2. If we had said n = 4, n! would have been 1 × 2 × 3 × 4 = 24)
So the probability of observing two infections per cell given an MOI of 1 is 0.1839, or 18.39%.
Probability of infection and non-infection
Why is this important? Actually, for our purposes, we don’t need to worry about how many viruses end up in a single cell. What we do need to understand – and what the Poisson distribution helps us with – is two key points:
- If some cells get more than one virus, it means that other cells will get no virus at all.
- For any given MOI (the average number of viruses per cell), we can calculate the percentage of cells that will not get any virus, which we will call P(0).
Logically, if we know the proportion of cells that will not be infected, subtracting this value from 100% tells us what proportion of infected will be infected (regardless of the number of viruses each infected cell receives). Let’s see how this works.
For an MOI of 1, according to the Poisson distribution, the percentage of cells that receive no virus corresponds also to 36.79 % of cells:
P(n) = (MOIn × e-MOI )/ n!
P(0) = (10 × e-1) = 1 × 0.3679 = 0.3679
So, if 36.79% of cells don’t become infected, how many cells do become infected? Based just on probability calculations (nothing to do with biology), at an MOI of 1, only about 63% of cells are expected to become infected: 100% – 36.79% = 63%.
100% – percentage of cells not infected = percentage of cells infected
As mathematics always tends to work, this is actually pretty close to what happens in real-world experiments when we infect a very permissive cell line.
A simplified formula
So, we can use the simplified formula below to tell us the proportion of cells with zero infection events:
P(0) = e-MOI
And, from this point, by simple subtraction, we can find what we’re really interested in, i.e., the percentage of infected cells (regardless of how many viruses have ended up infecting the same cell).
So, at an MOI of 2, without the need to do any experiment, we expect 86% of cells to become infected.
Using our simplified formula:
P(0) = e-MOI = e-2 = 1 / e2 = 1 / 2.718282 = 1 / 7.389 = 0.1353 (~14% of cells not infected)
By substraction: 100% – 14% = 86% infected
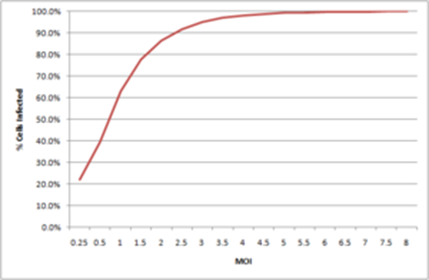
And we can do the same for other MOIs. At an MOI of 3, we expect 95% of cells to become infected, and the plateau around 99% is reached at an MOI of 5, with about 100% of cells infected at MOI 9. This is the reason why, if we want to ensure that all cells are infected, we need to use an MOI higher than 5. As most cells are not completely permissive, the MOI necessary to reach complete infection is generally higher.
If we now look at MOIs lower than 1, we have that, for instance, at MOI 0.5 we obtain 40% infection, and at MOI 0.1 we obtain 10% infection. By plotting these infection percentages as a function of the MOI we obtain the graph below:
From here, we can now convert form TCID50 to IU
Since the MOI can ultimately be described in terms of infectious units our P(0) = e-MOI can also be written as:
P(0) = e -IU/ml
From TCID50 to infectious units
Let’s now re-arrange this equation to determine the number of IU when we know P(0). Remember that P(0) is the probability of not being infected!
P(0) = e –IU/ml becomes IU/ml = –lne P(0)
Now consider our TCID50: the concentration of virus with a 50% chance of infection
At the limiting dilution of our TCID50 assay, we have a 50% chance of infection, which means a 50% chance of non-infection, so 𝑃(0) = 0.5
Now, substituting 𝑃(0) = 0.5 into the rearranged equation:
IU/ml = –lne (0.5)
lne(0.5) = –0.693
So, IU/ml = −(−0.693) = 0.693
And this is often rounded to 0.7 for simplicity.
Therefore, at 50% infection, we have approx. 0.7 IU per cell. Or we can say that 1 TCID50 corresponds to 0.7 IU. Hence, whenever we need to convert TCID50/ml values into IU/ml values, we multiply by 0.7. Glad we got there, eventually!
The importance of reporting units of measure
In the logarithmic context of virus quantification, a factor of 0.7 may well be within the experimental error of the quantification assay used, so often this conversion is not carried out. In the previous blog, we have also seen that small differences in titres can be obtained by using different methods of TCID50 calculation, adding further variability. For these reasons, such a conversion is not going to greatly increase the accuracy of the virus titre; however, it is important to know that, because of their probabilistic nature, TCID50 titres are slightly higher than plaque assay titres.
Therefore, it is always important to report the unit of measure TCID50 or IU, as it provides not only information on the amount of infectious virus but also on the assay used to determine it.
Have we just told you that all this palaver was unnecessary? Possibly, but in the search for the origin of our 0.7 factor, we have learned how to estimate the likelihood of infection depending on the MOI (very useful for experimental purposes), the likelihood of a cell being infected by different numbers of viruses, and that, somehow, maths always works.